Observability
Observability is crucial for understanding the internal states of your applications and infrastructure, allowing you to proactively monitor performance, diagnose issues, and ensure system reliability. Noback leverage AWS CloudWatch and AWS X-Ray to achieve comprehensive observability.
AWS CloudWatch
CloudWatch is a monitoring service that provides actionable insights and operational visibility into your AWS resources and applications.
- Metrics and Alarms: Track metrics for resources such as DynamoDB, Lambda, S3 or API Gateway. Additionaly you can set alarms to trigger notifications or automated actions when specific thresholds are reached.
- Logs: All lambdas are automatically configured from the SAM template to report its own logs to an specific log group, allowing querying and analysis.
- Dashboards: Create customizable dashboards that provide real-time insights into the health and performance of your system components (🔴 we can create a simple one from the YAML file)
AWS X-Ray
X-Ray is a tracing service that helps debug and analyze distributed applications, such as those built using microservices architecture. It provides an end-to-end view of requests as they travel through your system, making it easier to pinpoint bottlenecks or faults.
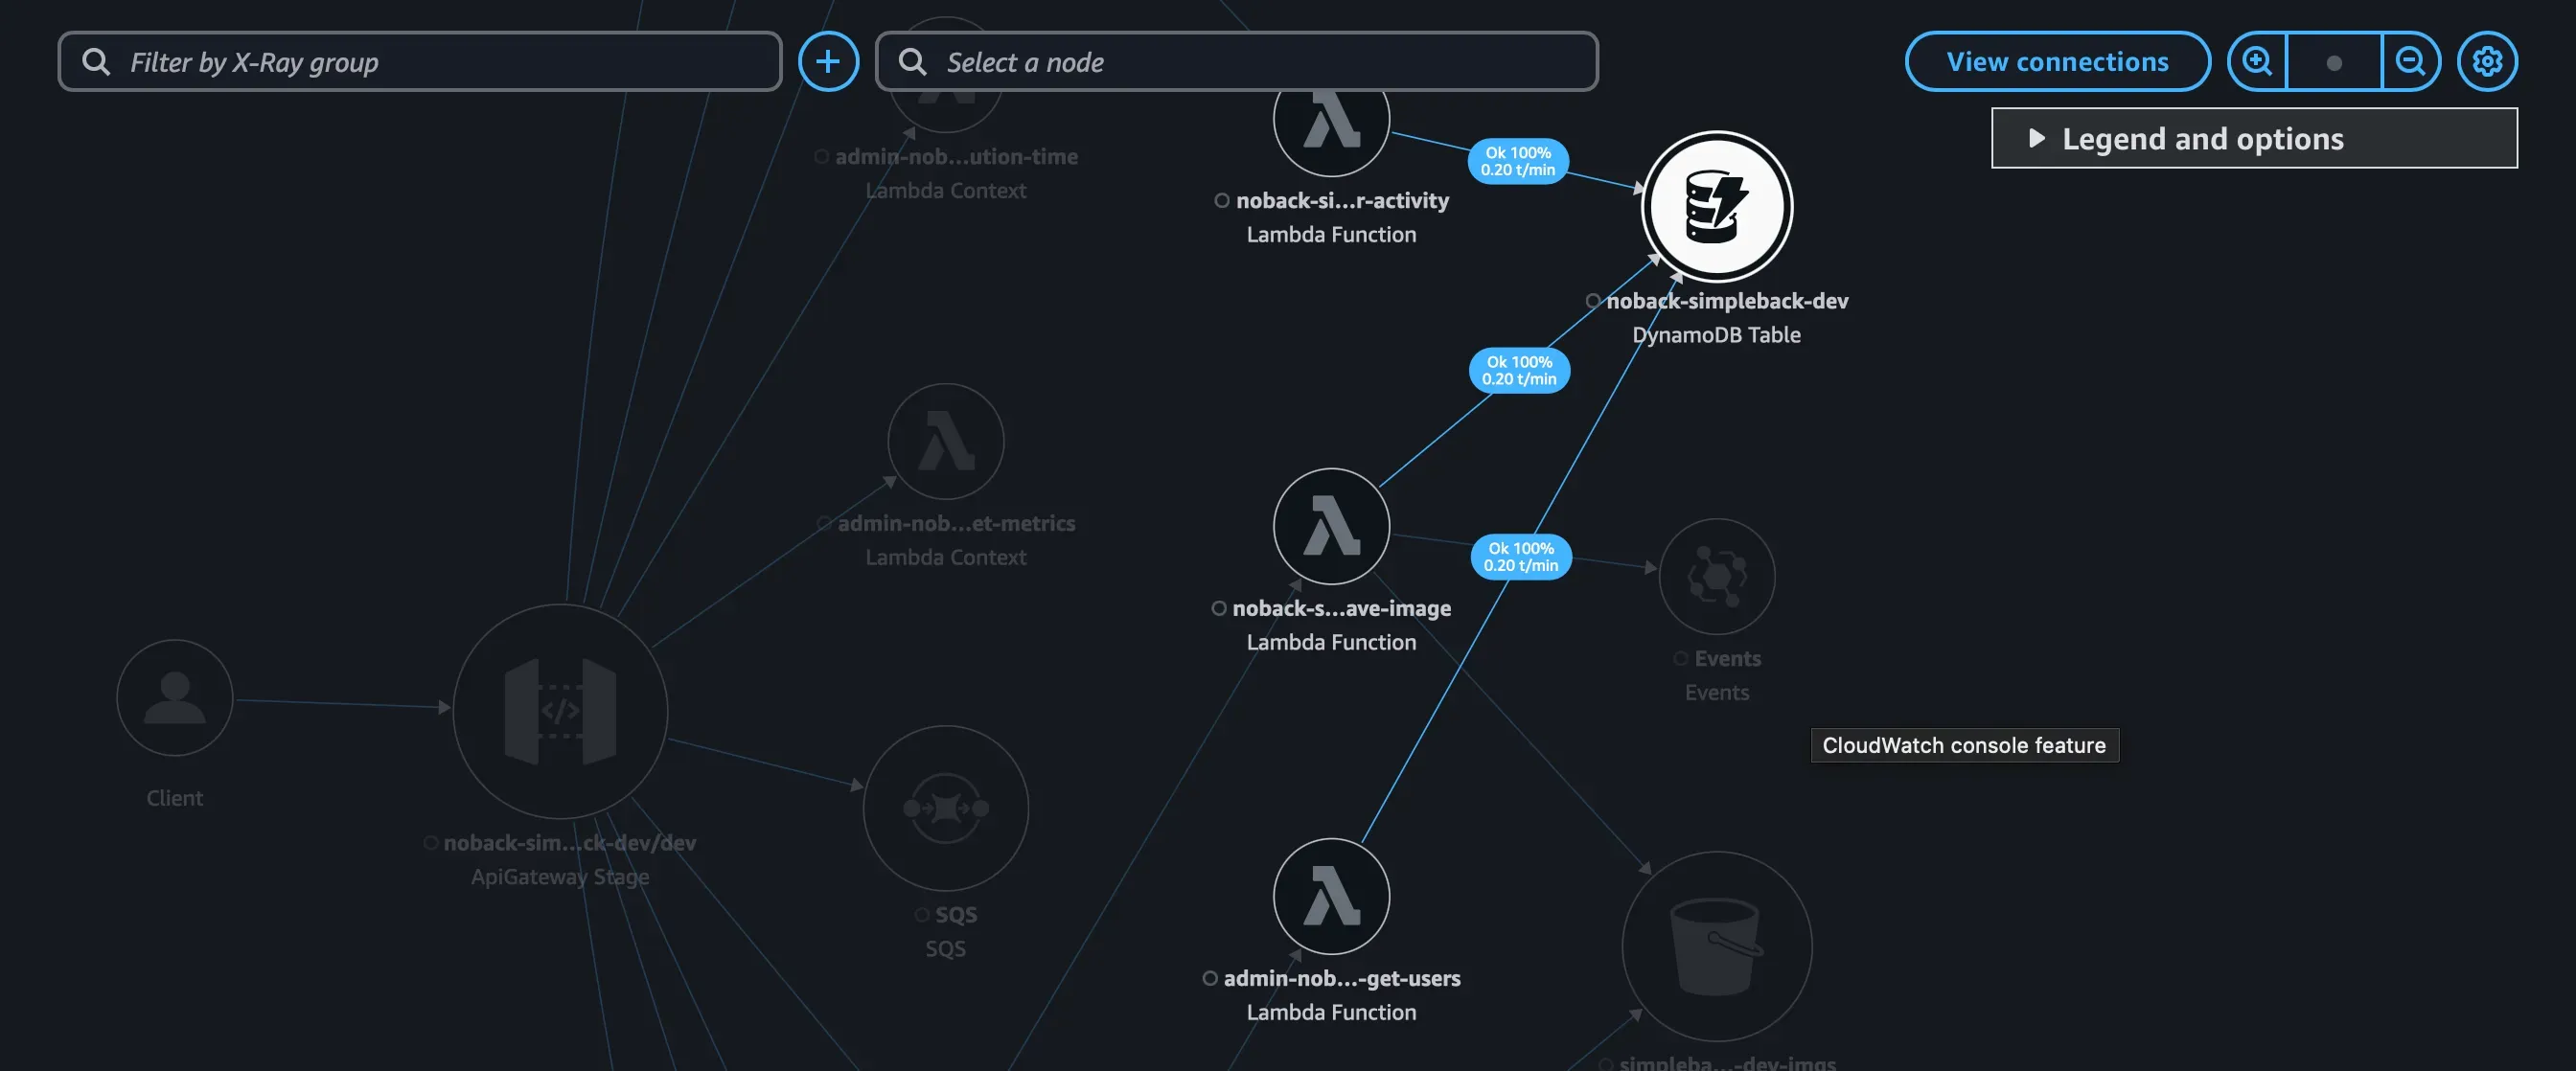
This is really convenient to quickly detect errors, latency issues and their root causes through detailed tracing information.
Recommended Usage:
Regularly review the X-Ray service map and traces to understand system behavior, diagnose performance issues, and optimize application components to address issues proactively.
In combination with cloudwatch, we get real-time observability and deep insights into your system’s health. Check 🔴 lambdas to check how to use the profiling helper and the lambda resources to optimize lambda performance.